OEM vs Aftermarket Oil Filters: Complete Quality Comparison Guide for Wholesale Distributors (2026)
Complete comparison of OEM vs aftermarket oil filters for wholesale distributors. Learn quality standards, cost analysis, profit margins, and sourcing strategies to maximize your automotive parts business in 2026.
博客
2/28/2026
Introduction: The $50,000 Question Every Distributor Must Answer
When a Florida automotive parts distributor received complaints about premature engine wear from three different customers within the same month, he faced a critical business decision. His company had recently switched from OEM-branded oil filters to a cheaper aftermarket alternative to increase profit margins from 28% to 42%. The cost savings looked attractive on paper—$1.85 per unit instead of $3.20—but the warranty claims, customer losses, and reputation damage cost his business over $50,000 in six months.
Meanwhile, his competitor maintained steady growth by offering a carefully curated mix of premium aftermarket filters that matched or exceeded OEM specifications, priced competitively at $2.40 per unit with 35% margins. The difference? Understanding that "aftermarket" doesn't automatically mean inferior, and "OEM" doesn't guarantee superiority.
The OEM vs aftermarket oil filter debate is one of the most misunderstood topics in the automotive parts distribution industry. Wholesale distributors face constant pressure to balance quality, pricing, and profitability while navigating conflicting claims from manufacturers, mechanics, and marketing materials.
The Reality of the Oil Filter Market (2026):
Global market size: $8.2 billion annually, growing at 6.8% CAGR
OEM market share: 35% of replacement filter sales
Aftermarket share: 65% of replacement filter sales
Premium aftermarket segment: Growing 12% annually, now 28% of aftermarket sales
Price differential: OEM filters typically cost 40-80% more than standard aftermarket, but only 10-25% more than premium aftermarket
Quality overlap: 35-40% of aftermarket filters meet or exceed OEM specifications when properly tested
What This Guide Covers:
Technical comparison of OEM vs aftermarket construction and materials
Quality standards, certifications, and testing protocols
Real-world performance data and filtration efficiency analysis
Cost breakdown and profit margin analysis for distributors
Manufacturing reality: Who actually makes OEM filters
How to identify premium aftermarket filters that match OEM quality
Sourcing strategies for wholesale distributors
Customer education and positioning strategies
The Core Question This Guide Answers:
Should wholesale distributors stock OEM filters, aftermarket filters, or both—and how do you maximize profitability while maintaining quality standards that protect your reputation and customer relationships?
Understanding the OEM vs Aftermarket Distinction
What "OEM" Actually Means
OEM (Original Equipment Manufacturer) is one of the most misunderstood terms in the automotive parts industry. Most vehicle manufacturers do not produce their own oil filters. Instead, they contract with specialized filter manufacturers who produce filters to the automaker's specifications, which are then branded with the vehicle manufacturer's logo.
The OEM Manufacturing Reality:
Major OEM Filter Suppliers:
Mann+Hummel: Supplies OEM filters for Mercedes-Benz, Volkswagen, Audi, Volvo, and many others
Champion Labs (owned by First Brands Group): Produces filters for Ford (Motorcraft), GM (ACDelco), Chrysler (Mopar), and Subaru
Denso (partially owned by Toyota): Primary supplier for Toyota, Lexus, and some Honda models
Mahle: Supplies BMW, Porsche, and various European brands
Bosch: OEM supplier for multiple European manufacturers
Fram (owned by Trico): Supplies some OEM applications despite being known as an aftermarket brand
What This Means for Distributors:
When you purchase an "OEM" filter from a dealership parts department, you're often buying the exact same filter that the same manufacturer sells under their own brand in the aftermarket—but at a 40-80% markup. The filter bearing a Ford Motorcraft logo and the Champion Labs filter on the auto parts store shelf may have been produced on the same production line, with identical specifications.
OEM Filter Characteristics:
Specification Control: The vehicle manufacturer defines minimum performance standards (filtration efficiency, pressure drop, burst strength, etc.)
Brand Premium: OEM filters carry the vehicle manufacturer's brand and warranty backing
Fitment Guarantee: Designed specifically for the target vehicle application with precise dimensional specifications
Consistent Quality: Subject to the vehicle manufacturer's quality control processes and supplier audits
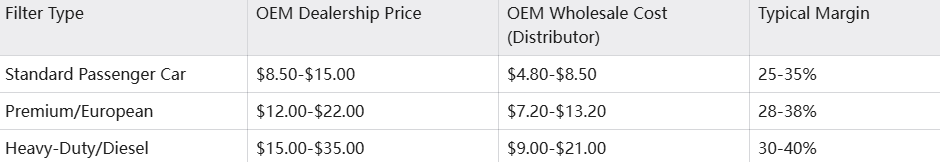
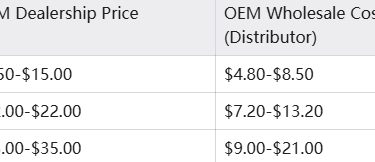
Price Premium: Typically 40-80% higher than standard aftermarket alternatives
OEM Pricing Structure (2026 Market Data):
What "Aftermarket" Actually Means
The aftermarket encompasses everything sold outside the vehicle manufacturer's dealer network. This includes filters manufactured by the same companies that produce OEM filters, as well as independent manufacturers ranging from premium quality to budget-oriented products.
Aftermarket Filter Categories:
1. Premium Aftermarket (Tier 1)
These filters often meet or exceed OEM specifications and are manufactured by reputable companies with ISO 9001 and IATF 16949 certifications.
Leading Premium Aftermarket Brands:
Wix Filters (owned by Mann+Hummel): Known for high filtration efficiency and durability
Purolator: Long-established brand with strong quality reputation
K&N: Premium performance filters with high flow rates
Mobil 1: Synthetic media filters designed for extended drain intervals
Royal Purple: High-efficiency synthetic media filters
Bosch (aftermarket line): Leverages OEM manufacturing expertise
Characteristics:
Filtration efficiency: 95-99.5% at 20-30 microns
Synthetic or premium cellulose media
Heavy-duty construction with reinforced canisters
Anti-drainback valves and bypass valves meeting OEM specifications
Price range: $6.50-$14.00 retail ($3.80-$8.40 wholesale)
Distributor margins: 35-45%
2. Standard Aftermarket (Tier 2)
These filters meet basic industry standards and provide adequate protection for normal driving conditions. They represent the largest volume segment of the aftermarket.
Common Standard Aftermarket Brands:
Fram (standard line): High market share, adequate quality for normal service intervals
STP: Budget-friendly option with acceptable performance
Carquest (Advance Auto Parts house brand): Manufactured by various suppliers
AutoZone Duralast: House brand with variable quality depending on specific product line
NAPA Gold (manufactured by Wix): Good quality at mid-range pricing
Characteristics:
Filtration efficiency: 90-95% at 25-35 microns
Cellulose (paper) media
Standard steel or composite construction
Basic anti-drainback and bypass valves
Price range: $4.50-$8.00 retail ($2.40-$4.80 wholesale)
Distributor margins: 30-40%
3. Economy Aftermarket (Tier 3)
Budget-oriented filters manufactured primarily in China and other low-cost production regions. Quality varies significantly, with some meeting basic standards while others fall short of minimum performance requirements.
Characteristics:
Filtration efficiency: 85-92% at 30-40 microns (when tested; many are not)
Cellulose media with lower dirt-holding capacity
Thin-gauge steel construction
Inconsistent anti-drainback valve quality
Price range: $2.50-$5.00 retail ($1.20-$2.80 wholesale)
Distributor margins: 40-55% (higher percentage but lower absolute profit)
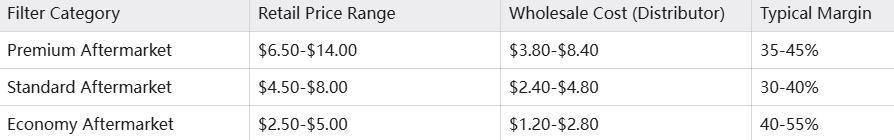
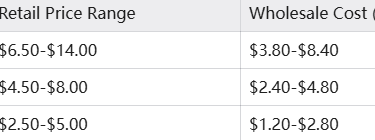
Aftermarket Pricing Structure (2026 Market Data):
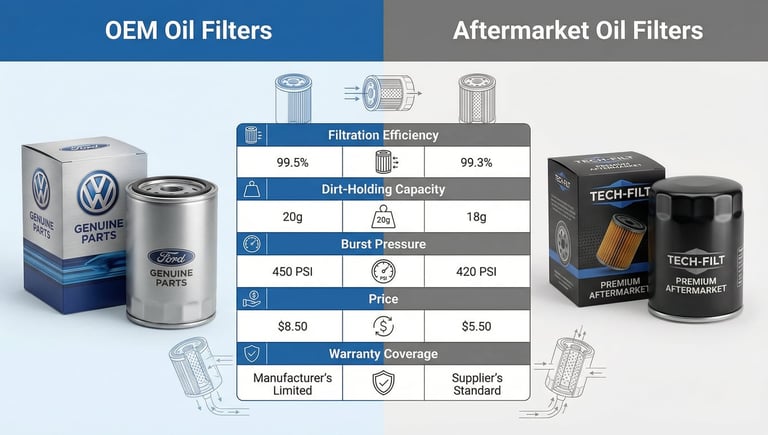
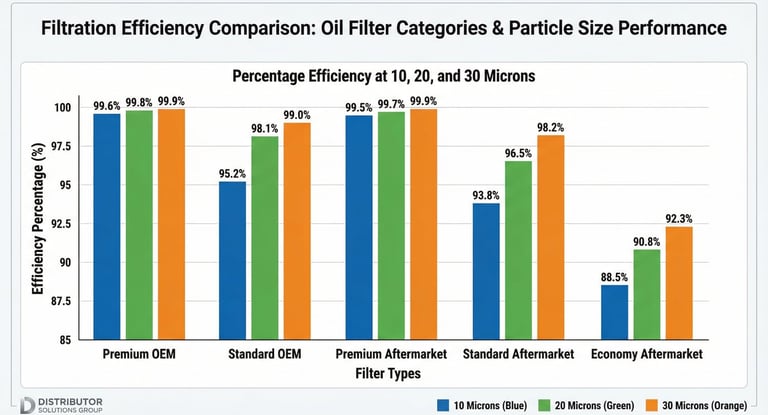
Technical Specifications: OEM vs Aftermarket Performance Standards
Understanding the technical specifications that define oil filter performance is essential for wholesale distributors who need to evaluate products objectively rather than relying on marketing claims or brand reputation alone.
Critical Performance Specifications
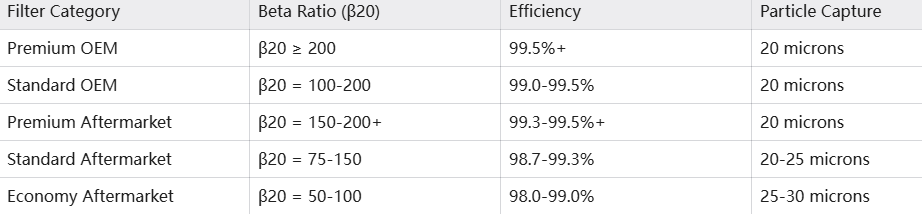
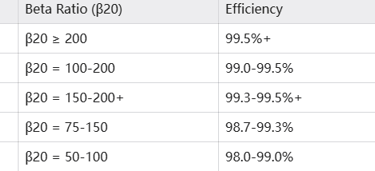
1. Filtration Efficiency (Beta Ratio)
Filtration efficiency measures the filter's ability to remove particles of a specific size from the oil. The industry standard measurement is the Beta Ratio, expressed as βX, where X is the particle size in microns.
Beta Ratio Formula:
β20 = 75 means the filter captures 98.7% of particles 20 microns or larger
β20 = 200 means the filter captures 99.5% of particles 20 microns or larger
β10 = 200 means the filter captures 99.5% of particles 10 microns or larger (higher performance)
Industry Standards (ISO 4548-12 Testing):
Real-World Performance Impact:
The difference between 98.7% and 99.5% efficiency might seem small, but over a 5,000-mile oil change interval, it represents significant variation in the total amount of contaminants circulating through the engine:
99.5% efficiency: Allows approximately 0.5% of contaminants to pass = 5 grams per 1,000 grams of contaminants
98.7% efficiency: Allows approximately 1.3% of contaminants to pass = 13 grams per 1,000 grams of contaminants
Difference: 2.6x more contaminants with the lower-efficiency filter
For engines operating in dusty environments or with extended drain intervals (7,500-10,000 miles), this difference becomes critical to engine longevity.
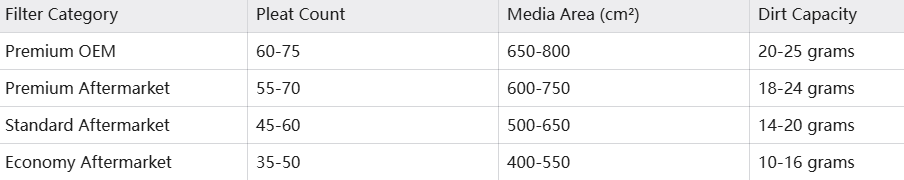
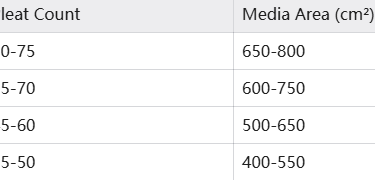
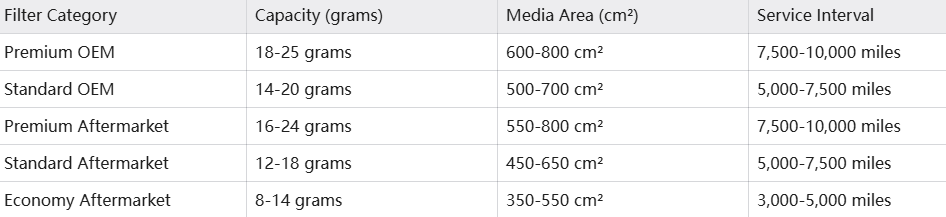
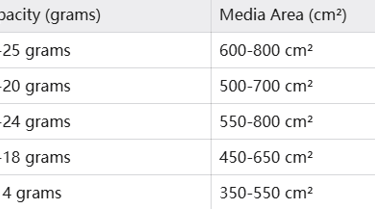
2. Dirt-Holding Capacity
Dirt-holding capacity measures how much contamination the filter can capture before reaching its maximum pressure drop (restriction) and triggering the bypass valve. Higher capacity means longer effective filter life.
Typical Dirt-Holding Capacity:
Factors Affecting Dirt-Holding Capacity:
Filter media area: Larger pleated surface = higher capacity
Media type: Synthetic media typically holds more than cellulose
Pleat design: Optimal spacing prevents premature clogging
Media thickness: Thicker media provides more depth filtration
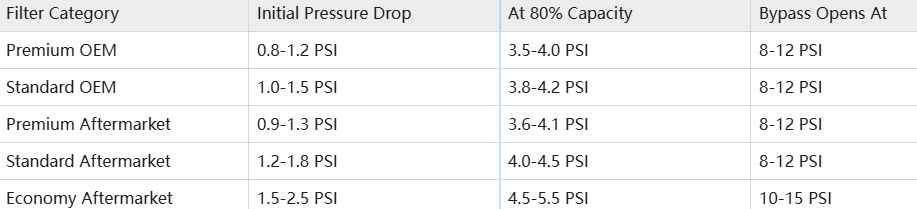
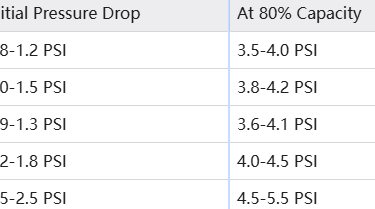
3. Pressure Drop (Flow Restriction)
Pressure drop measures the resistance to oil flow through the filter. Lower pressure drop means better oil circulation and reduced stress on the oil pump.
Industry Standard: Maximum pressure drop of 0.03 MPa (4.35 PSI) at normal operating flow rates
Typical Pressure Drop Values:
Why This Matters:
Higher pressure drop forces the oil pump to work harder, potentially reducing oil pressure to critical engine components. In extreme cases, excessive restriction can cause the bypass valve to open prematurely, allowing unfiltered oil to circulate through the engine.
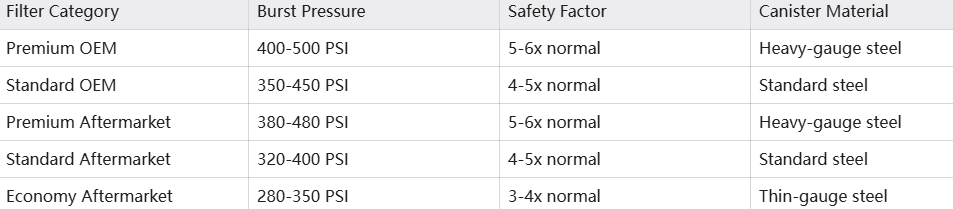
4. Burst Strength
Burst strength measures the maximum internal pressure the filter canister can withstand before structural failure. This is critical for engine protection during cold starts when oil viscosity is high and pressure spikes occur.
Industry Standard (ISO 4548-12): Minimum burst pressure of 300 PSI (20 bar), with premium filters tested to 400+ PSI
Typical Burst Strength:
Real-World Failure Scenarios:
Economy filters with thin-gauge steel canisters and inadequate seam welding can fail catastrophically during cold-start pressure spikes, causing sudden loss of oil pressure and potential engine damage. This is particularly problematic in cold climates where oil viscosity is highest during startup.
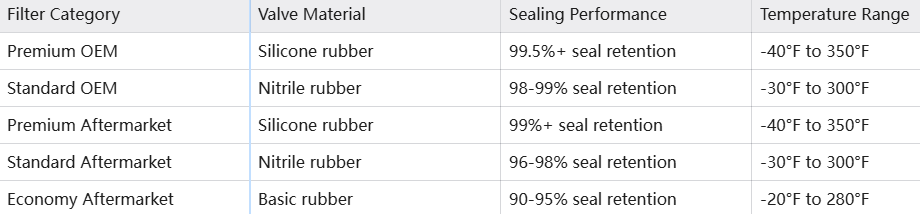
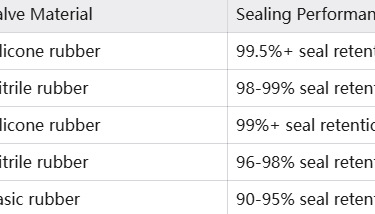
5. Anti-Drainback Valve Performance
The anti-drainback valve prevents oil from draining out of the filter when the engine is shut off, ensuring immediate oil pressure upon startup and preventing dry starts.
Performance Criteria:
Sealing effectiveness: Must prevent oil drainage for 24+ hours
Temperature resistance: Must function from -40°F to 300°F
Material durability: Silicone or nitrile rubber that resists oil degradation
Typical Anti-Drainback Valve Quality:
Impact of Poor Anti-Drainback Valve:
Filters with inadequate anti-drainback valves allow oil to drain back into the oil pan overnight. This causes:
Delayed oil pressure buildup during startup (2-5 seconds)
Increased wear on valve train components
Potential engine damage during cold starts
Reduced engine longevity (estimated 10-15% reduction in engine life)
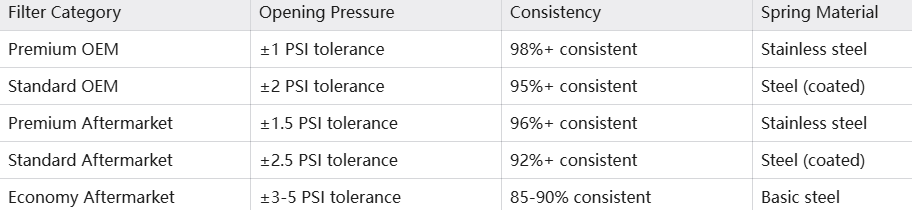
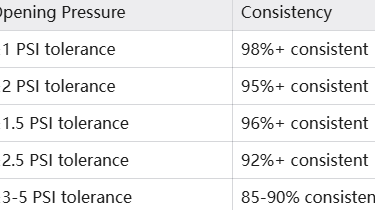
6. Bypass Valve Specifications
The bypass valve opens when the filter becomes clogged or oil viscosity is too high (cold starts), allowing unfiltered oil to circulate rather than starving the engine of lubrication.
Bypass Valve Opening Pressure:
Standard specification: 8-12 PSI differential pressure
Cold-weather applications: 6-9 PSI (opens earlier to prevent oil starvation)
High-performance applications: 12-15 PSI (maintains filtration longer)
Bypass Valve Quality Indicators:
Why Bypass Valve Consistency Matters:
Inconsistent bypass valve opening pressure means some filters in a production batch open too early (allowing unfiltered oil circulation under normal conditions) while others open too late (risking oil starvation). Premium filters maintain tight tolerances through precision manufacturing and quality control.
Manufacturing Reality: Who Actually Makes Your Filters
One of the most important insights for wholesale distributors is understanding that the OEM vs aftermarket distinction is often more about branding and distribution channels than actual manufacturing differences.
The Filter Manufacturing Oligopoly
The global automotive filter industry is dominated by a small number of large manufacturers who produce filters for multiple brands across both OEM and aftermarket channels.
Top 5 Global Filter Manufacturers (2026 Market Share):
1. Mann+Hummel (Germany) - 22% Global Market Share
OEM Clients: Mercedes-Benz, Volkswagen, Audi, Volvo, BMW (some applications)
Aftermarket Brands: Mann Filter, Wix Filters (acquired 2016)
Production Capacity: 500+ million filters annually
Quality Certifications: ISO 9001, IATF 16949, ISO 14001
Manufacturing Locations: Germany, USA, China, Brazil, India
2. Mahle Group (Germany) - 15% Global Market Share
OEM Clients: BMW, Porsche, Volkswagen, Ford, GM
Aftermarket Brands: Mahle Original, Knecht
Production Capacity: 380+ million filters annually
Quality Certifications: ISO 9001, IATF 16949
Manufacturing Locations: Germany, USA, Mexico, China
3. Denso Corporation (Japan) - 12% Global Market Share
OEM Clients: Toyota, Lexus, Honda (some applications), Mazda
Aftermarket Brands: Denso First Time Fit
Production Capacity: 320+ million filters annually
Quality Certifications: ISO 9001, IATF 16949, ISO 14001
Manufacturing Locations: Japan, USA, Thailand, China
Note: Partially owned by Toyota (24.5% stake)
4. Bosch (Germany) - 11% Global Market Share
OEM Clients: Multiple European manufacturers
Aftermarket Brands: Bosch Workshop (premium), Bosch (standard)
Production Capacity: 290+ million filters annually
Quality Certifications: ISO 9001, IATF 16949
Manufacturing Locations: Germany, USA, China, India
5. Champion Labs / First Brands Group (USA) - 9% Global Market Share
OEM Clients: Ford (Motorcraft), GM (ACDelco), Chrysler (Mopar), Subaru
Aftermarket Brands: Fram, Prestone, Autolite
Production Capacity: 240+ million filters annually
Quality Certifications: ISO 9001, IATF 16949
Manufacturing Locations: USA, Mexico, China
Other Significant Manufacturers:
Purolator (USA): 6% market share, strong aftermarket presence
Sogefi Group (Italy): 5% market share, OEM and aftermarket
UFI Filters (Italy): 4% market share, European focus
Chinese manufacturers (various): Combined 16% market share, primarily economy aftermarket
The Same Factory, Different Labels Reality
Understanding that the same manufacturer often produces both OEM and aftermarket filters is crucial for distributor sourcing decisions.
Example 1: Champion Labs Production Lines
Champion Labs operates manufacturing facilities that produce filters for multiple brands simultaneously:
Same Production Line, Different Labels:
Ford Motorcraft FL-820-S (OEM) - Wholesale cost: $4.80
ACDelco PF63E (OEM) - Wholesale cost: $4.60
Fram PH3980 (Aftermarket) - Wholesale cost: $2.80
Prestone AF3980 (Aftermarket) - Wholesale cost: $2.40
Manufacturing Reality:
Same factory (Champion Labs, Illinois facility)
Same production equipment
Same base filter media (cellulose blend)
Same anti-drainback valve design
Same quality control processes
Primary difference: Branding, packaging, and distribution markup
Why the Price Difference?
The OEM filters carry a 40-60% price premium primarily due to:
Brand licensing fees: Vehicle manufacturers charge 15-25% royalty on OEM-branded parts
Dealer distribution markup: Dealership parts departments add 30-50% markup
Warranty backing: OEM filters include vehicle manufacturer warranty support
Lower volume per SKU: OEM filters are vehicle-specific, reducing economies of scale
Example 2: Mann+Hummel / Wix Relationship
After Mann+Hummel acquired Wix Filters in 2016, the relationship between OEM and aftermarket became even more transparent:
Same Manufacturer, Multiple Brands:
Mercedes-Benz 000 180 00 09 (OEM) - Wholesale cost: $8.20
Mann W 712/75 (Premium Aftermarket) - Wholesale cost: $5.40
Wix 51356 (Premium Aftermarket) - Wholesale cost: $4.80
Manufacturing Reality:
Identical filter media specifications
Same synthetic fiber blend
Identical filtration efficiency (β20 = 200)
Same manufacturing facility (Germany or USA depending on market)
Primary difference: Brand positioning and distribution channel markup
When OEM and Aftermarket Filters Actually Differ
While many OEM and aftermarket filters are functionally identical, there are scenarios where meaningful differences exist:
1. Premium OEM Specifications
Some vehicle manufacturers specify enhanced filter performance beyond industry standards, particularly for:
High-performance engines: Porsche, BMW M-series, Mercedes-AMG
Turbocharged engines: Require higher filtration efficiency to protect turbocharger bearings
Diesel engines: Often specify multi-stage filtration or water separation
Hybrid vehicles: May require specific flow characteristics
Example: BMW High-Performance Oil Filters
BMW specifies enhanced filtration for M-series engines:
Filtration efficiency: β10 = 200 (99.5% at 10 microns, not just 20 microns)
Dirt-holding capacity: 25+ grams (vs 18-20 grams standard)
Bypass valve pressure: 15 PSI (vs 10-12 PSI standard)
Temperature rating: -40°F to 400°F (vs -30°F to 350°F standard)
Aftermarket Alternative:
Mann HU 925/4 X: Meets BMW specifications, manufactured by Mann+Hummel (same supplier as OEM)
Wholesale cost: $6.80 vs $10.20 for BMW-branded OEM
Performance: Identical specifications, same manufacturing facility
2. Economy Aftermarket Compromises
Budget-oriented aftermarket filters often reduce costs through:
Thinner filter media: Reduces dirt-holding capacity by 20-30%
Lower-grade materials: Thinner steel canisters, basic rubber compounds
Simplified valve designs: Less precise bypass valve tolerances
Reduced quality control: Higher variation between units in the same production batch
Example: Economy Filter Cost Reductions
A typical economy aftermarket filter achieves $1.20 wholesale cost through:
Filter media: $0.35 (vs $0.60 for premium cellulose or $1.20 for synthetic)
Canister steel: $0.25 (vs $0.45 for heavy-gauge steel)
Anti-drainback valve: $0.08 (vs $0.18 for silicone compound)
Bypass valve spring: $0.05 (vs $0.12 for precision-manufactured spring)
Quality control: $0.04 (vs $0.15 for comprehensive testing)
Labor & overhead: $0.28
Manufacturer profit: $0.15
Total cost: $1.20 vs $2.30 for premium aftermarket or $3.20 for OEM
Performance Impact:
Filtration efficiency: 90% vs 99%+ (allows 10x more contaminants to pass)
Dirt-holding capacity: 10 grams vs 20 grams (half the service life)
Burst strength: 300 PSI vs 450 PSI (lower safety margin)
Anti-drainback effectiveness: 92% vs 99%+ (more oil drainback overnight)
Cost Analysis and Profit Margin Comparison for Distributors
Understanding the complete cost structure and profit potential of OEM vs aftermarket filters is essential for wholesale distributors to make informed inventory and pricing decisions.
Wholesale Cost Structure Breakdown
OEM Filter Cost Structure (Example: Standard Passenger Car Filter)
Retail Price: $12.50 (dealership parts department)
Cost Breakdown:
Manufacturer production cost: $2.80
OEM brand licensing fee: $0.70 (20% of production cost)
Manufacturer profit margin: $0.50
Wholesale price to dealer: $4.00
Dealer markup: $8.50 (212% markup)
Retail price: $12.50
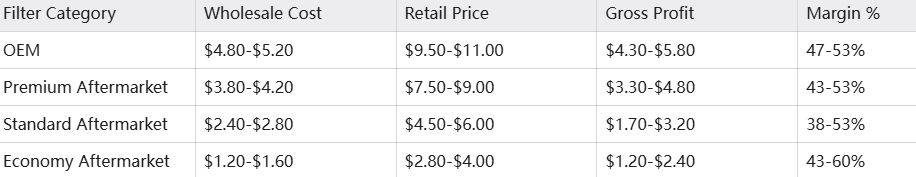
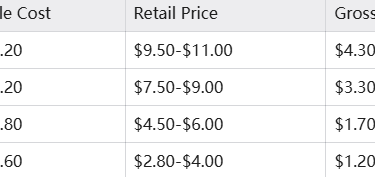
Distributor Wholesale Pricing:
Distributor wholesale cost: $4.80-$5.20 (purchased from OEM parts distribution network)
Distributor retail price: $9.50-$11.00
Distributor gross margin: $4.30-$5.80 per unit (47-53% margin)
Premium Aftermarket Filter Cost Structure (Example: Wix 51515)
Retail Price: $8.50 (auto parts store)
Cost Breakdown:
Manufacturer production cost: $2.60
Manufacturer profit margin: $1.20
Wholesale price to distributor: $3.80
Distributor markup: $4.70 (124% markup)
Retail price: $8.50
Distributor Wholesale Pricing:
Distributor wholesale cost: $3.80-$4.20
Distributor retail price: $7.50-$9.00
Distributor gross margin: $3.30-$4.80 per unit (43-53% margin)
Standard Aftermarket Filter Cost Structure (Example: Fram PH3980)
Retail Price: $5.50 (auto parts store)
Cost Breakdown:
Manufacturer production cost: $1.80
Manufacturer profit margin: $0.60
Wholesale price to distributor: $2.40
Distributor markup: $3.10 (129% markup)
Retail price: $5.50
Distributor Wholesale Pricing:
Distributor wholesale cost: $2.40-$2.80
Distributor retail price: $4.50-$6.00
Distributor gross margin: $1.70-$3.20 per unit (38-53% margin)
Economy Aftermarket Filter Cost Structure (Example: Generic Chinese Import)
Retail Price: $3.50 (discount auto parts store)
Cost Breakdown:
Manufacturer production cost: $0.90
Manufacturer profit margin: $0.30
Wholesale price to distributor: $1.20
Distributor markup: $2.30 (192% markup)
Retail price: $3.50
Distributor Wholesale Pricing:
Distributor wholesale cost: $1.20-$1.60
Distributor retail price: $2.80-$4.00
Distributor gross margin: $1.20-$2.40 per unit (43-60% margin)
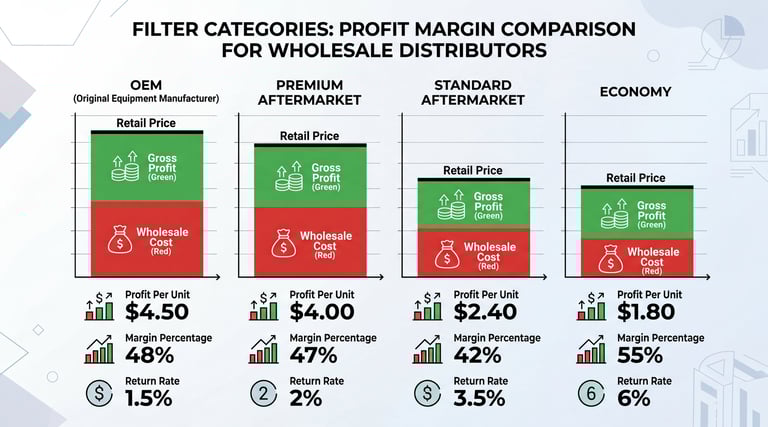
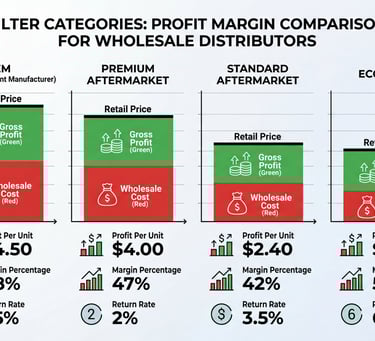
Profit Margin Analysis: Which Category Maximizes Distributor Profitability?
Absolute Profit Per Unit (Distributor Perspective):
Key Insights:
Highest absolute profit: OEM filters generate $4.30-$5.80 profit per unit, but require higher inventory investment
Best margin percentage: Economy filters offer 43-60% margins, but lowest absolute profit and highest risk
Balanced approach: Premium aftermarket filters offer $3.30-$4.80 profit with competitive pricing and quality
Volume considerations: Standard aftermarket filters have lower per-unit profit but typically sell in higher volumes
Volume-Based Profitability Analysis
Scenario: 1,000 Oil Filters Sold Monthly
OEM-Focused Strategy (70% OEM, 30% Aftermarket):
OEM filters sold: 700 units × $5.00 average profit = $3,500
Aftermarket filters sold: 300 units × $3.50 average profit = $1,050
Total monthly profit: $4,550
Inventory investment: $3,500 (higher per-unit cost)
Customer perception: Premium quality, higher prices
Premium Aftermarket Strategy (80% Premium Aftermarket, 20% OEM):
Premium aftermarket sold: 800 units × $4.00 average profit = $3,200
OEM filters sold: 200 units × $5.00 average profit = $1,000
Total monthly profit: $4,200
Inventory investment: $3,200 (moderate per-unit cost)
Customer perception: Quality at competitive prices
Mixed Strategy (40% Premium Aftermarket, 40% Standard Aftermarket, 20% OEM):
Premium aftermarket sold: 400 units × $4.00 average profit = $1,600
Standard aftermarket sold: 400 units × $2.40 average profit = $960
OEM filters sold: 200 units × $5.00 average profit = $1,000
Total monthly profit: $3,560
Inventory investment: $2,800 (lower per-unit cost)
Customer perception: Options for all budgets
Budget-Focused Strategy (70% Standard Aftermarket, 20% Economy, 10% Premium):
Standard aftermarket sold: 700 units × $2.40 average profit = $1,680
Economy aftermarket sold: 200 units × $1.80 average profit = $360
Premium aftermarket sold: 100 units × $4.00 average profit = $400
Total monthly profit: $2,440
Inventory investment: $2,100 (lowest per-unit cost)
Customer perception: Budget-friendly, potential quality concerns
Profitability Ranking:
OEM-Focused: $4,550/month (highest profit, highest investment, premium positioning)
Premium Aftermarket: $4,200/month (strong profit, moderate investment, value positioning)
Mixed Strategy: $3,560/month (moderate profit, lower investment, broad appeal)
Budget-Focused: $2,440/month (lowest profit, lowest investment, price-sensitive customers)
Hidden Costs That Impact Real Profitability
1. Warranty and Return Costs
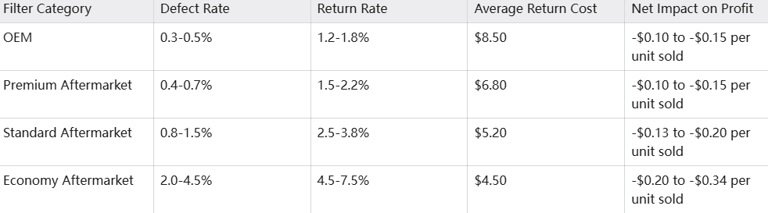
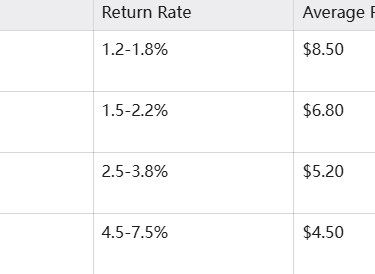
Different filter categories have significantly different failure and return rates:
Return Cost Components:
Processing labor and administrative time
Reverse logistics and restocking
Manufacturer credit processing delays
Customer goodwill gestures (discounts on future purchases)
Potential loss of customer relationship
Real-World Impact:
A distributor selling 1,000 economy filters monthly at $1.80 profit per unit might expect:
Gross profit: $1,800
Return rate: 6% (60 units)
Return processing cost: 60 × $4.50 = $270
Net profit: $1,530 (15% reduction)
Meanwhile, selling 1,000 premium aftermarket filters at $4.00 profit per unit:
Gross profit: $4,000
Return rate: 2% (20 units)
Return processing cost: 20 × $6.80 = $136
Net profit: $3,864 (3.4% reduction)
2. Inventory Carrying Costs
Higher-priced filters require more capital investment and incur higher carrying costs:
Annual Inventory Carrying Cost Factors:
Cost of capital: 8-12% (opportunity cost of money tied up in inventory)
Storage costs: 2-4% (warehouse space, utilities, insurance)
Obsolescence risk: 1-3% (product changes, slow-moving inventory)
Shrinkage and damage: 0.5-1.5% (theft, handling damage, deterioration)
Total carrying cost: 12-20% of inventory value annually
Example: 500-Unit Standing Inventory
OEM Filter Inventory:
Inventory value: 500 × $5.00 = $2,500
Annual carrying cost (15%): $375
Monthly carrying cost: $31.25
Cost per unit sold (if 500 sold monthly): $0.06
Premium Aftermarket Inventory:
Inventory value: 500 × $4.00 = $2,000
Annual carrying cost (15%): $300
Monthly carrying cost: $25.00
Cost per unit sold (if 500 sold monthly): $0.05
Standard Aftermarket Inventory:
Inventory value: 500 × $2.60 = $1,300
Annual carrying cost (15%): $195
Monthly carrying cost: $16.25
Cost per unit sold (if 500 sold monthly): $0.03
3. Customer Acquisition and Retention Costs
Filter quality directly impacts customer retention, which affects long-term profitability:
Customer Lifetime Value Analysis:
Scenario: Auto Repair Shop Customer
Premium Filter Strategy:
Average order value: $450 (including filters and other parts)
Order frequency: 8 orders per year
Customer retention rate: 85% annually
Average customer lifetime: 4.2 years
Lifetime value: $450 × 8 × 4.2 = $15,120
Economy Filter Strategy:
Average order value: $380 (lower-priced parts)
Order frequency: 8 orders per year
Customer retention rate: 68% annually (higher defect rate reduces loyalty)
Average customer lifetime: 2.8 years
Lifetime value: $380 × 8 × 2.8 = $8,512
Difference: $6,608 lifetime value lost by focusing on economy filters
Customer Acquisition Cost:
Marketing and sales expenses: $200-$400 per new B2B customer
Break-even timeline: 1-2 orders for premium strategy, 2-4 orders for economy strategy
Quality Verification: How to Identify Premium Aftermarket Filters
For wholesale distributors, the ability to distinguish high-quality aftermarket filters from inferior products is critical to maintaining profitability while protecting customer relationships and reputation.
Certification and Standards Verification
1. ISO 9001 Certification (Quality Management Systems)
ISO 9001 is the international standard for quality management systems. Manufacturers with this certification have documented processes for quality control, continuous improvement, and customer satisfaction.
What to Verify:
Certificate authenticity: Check the issuing certification body (e.g., TÜV, SGS, BSI, DNV)
Scope of certification: Ensure it covers oil filter manufacturing, not just general automotive parts
Validity dates: Certificates expire every 3 years and require annual surveillance audits
Facility coverage: Verify which manufacturing facilities are covered
How to Verify:
Request certificate copy from supplier
Check certificate number with issuing body's online database
Contact certification body to confirm validity (phone or email)
Review scope statement to ensure oil filters are included
Red Flags:
Supplier refuses to provide certificate
Certificate is expired or approaching expiration without renewal documentation
Certificate covers only a headquarters office, not manufacturing facilities
Certification body is unknown or not accredited by IAF (International Accreditation Forum)
2. IATF 16949 Certification (Automotive Quality Management)
IATF 16949 is the automotive industry-specific quality standard that builds upon ISO 9001 with additional requirements for automotive suppliers. This is the gold standard for automotive parts manufacturers.
What IATF 16949 Requires:
Advanced Product Quality Planning (APQP)
Production Part Approval Process (PPAP)
Failure Mode and Effects Analysis (FMEA)
Statistical Process Control (SPC)
Measurement System Analysis (MSA)
Continuous improvement and defect prevention
Verification Process:
Request IATF 16949 certificate
Verify certificate with IATF database: https://www.iatfglobaloversight.org/
Check that certification covers oil filter production
Confirm annual surveillance audit compliance
Significance for Distributors:
IATF 16949 certification indicates that the manufacturer:
Supplies OEM customers (most OEMs require this certification)
Maintains rigorous quality control processes
Has documented traceability systems
Conducts regular internal audits and continuous improvement
Follows automotive industry best practices
Manufacturers with IATF 16949 are significantly more reliable than those with only ISO 9001 or no certification.
3. ISO 4548-12 Testing Compliance
ISO 4548-12 is the international standard for testing full-flow oil filters. Filters tested to this standard have verified performance data for:
Filtration efficiency (beta ratio)
Pressure drop characteristics
Dirt-holding capacity
Burst strength
Fatigue resistance
What to Request from Suppliers:
Test reports: Independent laboratory test results showing ISO 4548-12 compliance
Testing laboratory: Name and accreditation of testing facility
Test date: Reports should be recent (within 2 years) and representative of current production
Sample selection: Random samples from production, not pre-selected "golden samples"
Reputable Testing Laboratories:
Southwest Research Institute (SwRI) - USA
Intertek - Global
SGS - Global
TÜV Rheinland - Germany
DEKRA - Germany
How to Interpret Test Reports:
Example Test Report Data:
Filter Model: ABC-12345 Test Standard: ISO 4548-12:2016 Testing Laboratory: Southwest Research Institute Test Date: January 2026 Filtration Efficiency (ISO 16889): - β10(c) = 85 (98.8% efficiency at 10 microns) - β20(c) = 180 (99.4% efficiency at 20 microns) - β30(c) = 250 (99.6% efficiency at 30 microns) Dirt-Holding Capacity: 18.5 grams (at 75 kPa terminal pressure) Pressure Drop: - Initial (clean filter): 0.08 bar (1.16 PSI) - At 50% capacity: 0.25 bar (3.63 PSI) - At terminal pressure: 0.75 bar (10.88 PSI) Burst Pressure: 28 bar (406 PSI) Bypass Valve Opening Pressure: 0.8 ± 0.1 bar (11.6 ± 1.45 PSI)
Evaluation:
✓ Filtration efficiency: β20 = 180 is excellent (99.4% efficiency)
✓ Dirt-holding capacity: 18.5 grams is good for standard passenger car application
✓ Pressure drop: Low initial pressure drop indicates good flow characteristics
✓ Burst pressure: 406 PSI exceeds minimum standard (300 PSI) by 35%
✓ Bypass valve: Consistent opening pressure with tight tolerance
This filter meets or exceeds OEM specifications for most passenger car applications.
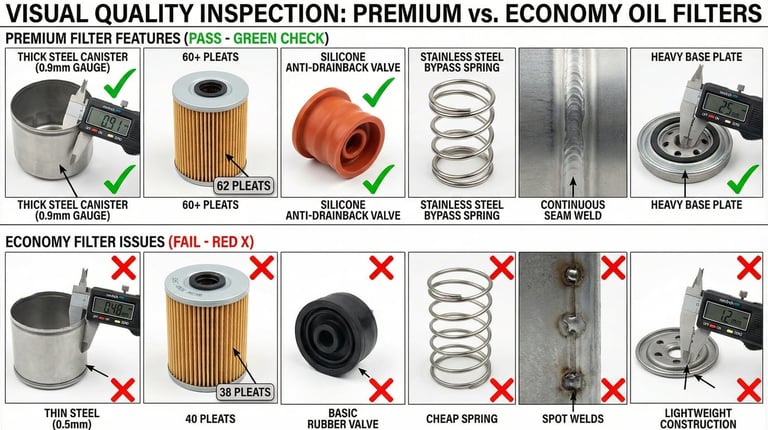
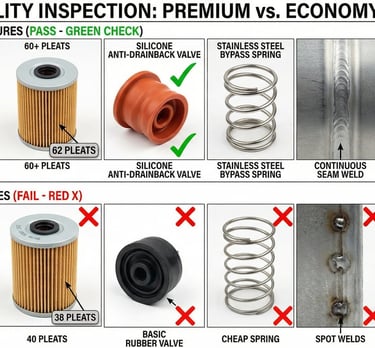
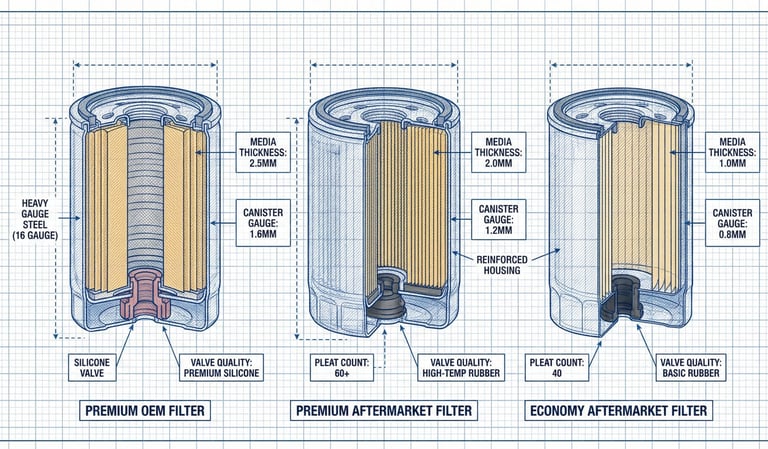
Physical Inspection and Quality Indicators
1. Canister Construction Quality
Premium Quality Indicators:
Steel thickness: 0.8-1.0mm gauge steel (measure with micrometer)
Seam welding: Continuous, uniform weld with no gaps or weak points
Thread quality: Precision-cut threads with consistent depth and spacing
Paint/coating: Uniform, chip-resistant coating (not just cosmetic)
Base plate: Heavy-gauge steel with reinforced mounting threads
Economy Quality Red Flags:
Thin steel (0.5mm or less) that flexes when squeezed
Spot welding instead of continuous seam welds
Rough or inconsistent thread cutting
Thin, easily chipped paint
Lightweight base plate with minimal reinforcement
Visual Inspection Test:
Squeeze test: Apply moderate pressure to canister sides. Premium filters resist deformation; economy filters flex noticeably.
Weight comparison: Premium filters weigh 15-25% more than economy filters of the same size due to heavier materials.
Thread inspection: Premium filters have clean, precisely cut threads; economy filters often have burrs or inconsistent thread depth.
2. Filter Media Quality
How to Inspect (Requires Cutting Open Filter):
Premium Filter Media:
Material: Synthetic fibers or premium cellulose blend
Color: Uniform white or light tan
Texture: Consistent thickness throughout pleats
Pleat count: 50-70 pleats for standard passenger car filter
Pleat spacing: Uniform spacing with no collapsed or compressed pleats
End caps: Securely bonded with no gaps or adhesive squeeze-out
Economy Filter Media:
Material: Basic cellulose (paper)
Color: May have brown or gray tint indicating lower-grade pulp
Texture: Inconsistent thickness, may have thin spots
Pleat count: 35-45 pleats (less surface area = lower capacity)
Pleat spacing: Irregular spacing, some pleats may be compressed
End caps: Visible adhesive squeeze-out or gaps
Pleat Count Comparison:
3. Anti-Drainback Valve Quality
Premium Quality Indicators:
Material: Silicone rubber (more temperature-resistant than nitrile)
Thickness: 2-3mm thick valve flap
Flexibility: Remains flexible when cold (test in freezer)
Sealing surface: Smooth, uniform contact surface with no imperfections
Attachment: Securely bonded or mechanically retained, not just pressed in place
Economy Quality Red Flags:
Basic rubber compound (hardens in cold temperatures)
Thin valve flap (1-1.5mm)
Stiff or inflexible material
Rough or uneven sealing surface
Loose fit or inadequate retention
Field Test:
Install filter on engine
Run engine for 10 minutes
Shut off engine and wait 24 hours
Remove filter and check for oil retention
Premium filter: Remains nearly full of oil
Economy filter: Significant oil drainage back to pan
4. Bypass Valve Quality
Premium Quality Indicators:
Spring material: Stainless steel (resists corrosion)
Spring consistency: Uniform coil spacing and wire diameter
Valve seat: Machined or molded seat with smooth sealing surface
Opening pressure: Consistent across multiple samples (±1-2 PSI)
Economy Quality Red Flags:
Basic steel spring (may rust over time)
Inconsistent coil spacing
Rough valve seat
Highly variable opening pressure (±3-5 PSI between samples)
Testing Bypass Valve Consistency:
Purchase 5-10 samples of the same filter model and test bypass valve opening pressure:
Premium Filter Results:
Sample 1: 11.2 PSI
Sample 2: 11.5 PSI
Sample 3: 11.0 PSI
Sample 4: 11.3 PSI
Sample 5: 11.4 PSI
Range: 0.5 PSI (excellent consistency)
Economy Filter Results:
Sample 1: 9.8 PSI
Sample 2: 12.5 PSI
Sample 3: 10.2 PSI
Sample 4: 13.8 PSI
Sample 5: 11.0 PSI
Range: 4.0 PSI (poor consistency)
Brand Reputation and Track Record
Tier 1 Premium Aftermarket Brands (Recommended for Quality-Focused Distributors):
1. Wix Filters (Mann+Hummel)
Reputation: Excellent quality, widely respected by mechanics
Manufacturing: USA and Germany facilities with IATF 16949 certification
Product range: Comprehensive coverage for passenger cars, light trucks, heavy-duty
Price positioning: Premium aftermarket ($4.50-$9.00 wholesale)
Warranty: 1-year / 12,000-mile warranty
Distributor support: Strong technical support and marketing materials
2. Purolator
Reputation: Long-established brand (since 1923), strong quality reputation
Manufacturing: USA facilities with ISO 9001 and IATF 16949
Product range: Excellent coverage for domestic and Asian vehicles
Price positioning: Premium aftermarket ($4.20-$8.50 wholesale)
Warranty: 1-year / 12,000-mile warranty
Distributor support: Good technical resources
3. Bosch (Aftermarket Line)
Reputation: Leverages OEM manufacturing expertise
Manufacturing: Germany and China facilities with IATF 16949
Product range: Strong European vehicle coverage
Price positioning: Premium aftermarket ($4.80-$9.50 wholesale)
Warranty: 1-year / 12,000-mile warranty
Distributor support: Excellent technical documentation
4. K&N
Reputation: Premium performance filters, high-flow design
Manufacturing: USA facilities with ISO 9001
Product range: Performance-oriented applications
Price positioning: Premium/performance ($7.00-$14.00 wholesale)
Warranty: 10-year / 1,000,000-mile warranty (unique selling point)
Distributor support: Strong brand recognition and marketing support
5. Mobil 1 (Champion Labs)
Reputation: Premium synthetic media filters
Manufacturing: Champion Labs USA facilities with IATF 16949
Product range: Focused on extended drain interval applications
Price positioning: Premium aftermarket ($5.50-$10.00 wholesale)
Warranty: 1-year / 15,000-mile warranty
Distributor support: Strong brand recognition (Mobil oil brand association)
Tier 2 Standard Aftermarket Brands (Good Balance of Quality and Price):
1. Fram (Standard Line)
Reputation: High market share, adequate quality for normal service intervals
Manufacturing: Champion Labs facilities (USA, Mexico, China)
Product range: Comprehensive coverage, highest SKU count in industry
Price positioning: Standard aftermarket ($2.80-$6.00 wholesale)
Warranty: 1-year / 12,000-mile warranty
Distributor support: Excellent availability and brand recognition
2. STP
Reputation: Budget-friendly with acceptable performance
Manufacturing: Various contract manufacturers
Product range: Good coverage for common applications
Price positioning: Standard aftermarket ($2.40-$5.50 wholesale)
Warranty: 1-year / 12,000-mile warranty
Distributor support: Moderate
3. Carquest (Advance Auto Parts)
Reputation: House brand with variable quality by product line
Manufacturing: Multiple suppliers (Wix for premium line, others for standard)
Product range: Comprehensive coverage
Price positioning: Standard aftermarket ($2.60-$6.50 wholesale)
Warranty: Varies by product line
Distributor support: Available through Advance Auto Parts distribution
Tier 3 Economy Brands (High Risk for Quality-Focused Distributors):
Generic Chinese Imports:
Reputation: Variable quality, high defect rates
Manufacturing: Various Chinese factories, often lacking certifications
Product range: Limited to common applications
Price positioning: Economy ($1.20-$3.50 wholesale)
Warranty: Limited or none
Distributor support: Minimal
Risk factors: High return rates (4-8%), potential liability issues, customer dissatisfaction
Sourcing Strategies for Wholesale Distributors
Developing an effective sourcing strategy requires balancing quality, cost, inventory investment, and customer expectations. Here are proven strategies for different distributor business models.
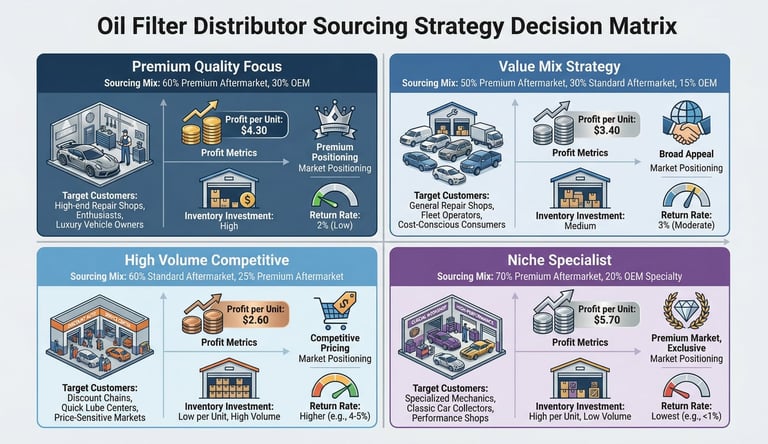
Strategy 1: Premium Quality Focus
Target Market: Professional repair shops, fleet maintenance, performance enthusiasts
Product Mix:
60% Premium aftermarket (Wix, Purolator, Bosch, K&N)
30% OEM (for customers who specifically request OEM)
10% Performance specialty (K&N, Mobil 1 extended life)
Advantages:
Higher profit margins ($3.50-$5.50 per unit average)
Lower return rates (1.5-2.5%)
Strong customer loyalty and retention
Premium brand positioning
Reduced liability risk
Challenges:
Higher inventory investment
Smaller customer base (not price-competitive for budget-focused shops)
Requires customer education on quality differences
Sourcing Approach:
Establish direct relationships with premium manufacturers (Wix, Purolator)
Negotiate volume discounts based on annual commitments
Maintain 60-90 day inventory to ensure availability
Focus on fast-moving SKUs (top 200 applications cover 80% of demand)
Financial Projections (1,000 filters/month):
Average wholesale cost: $4.20
Average retail price: $8.50
Average profit per unit: $4.30
Monthly gross profit: $4,300
Inventory investment: $12,600 (3-month supply)
Return cost impact: -$150/month (2% return rate)
Net monthly profit: $4,150
Strategy 2: Value-Oriented Mix
Target Market: Independent repair shops, quick-lube centers, general automotive service
Product Mix:
50% Premium aftermarket (Wix, Purolator)
30% Standard aftermarket (Fram, STP)
15% OEM (for specific customer requests)
5% Economy (for price-sensitive customers)
Advantages:
Balanced profit margins ($2.80-$4.50 per unit average)
Broad customer appeal (options for different budgets)
Moderate inventory investment
Competitive pricing while maintaining quality standards
Challenges:
More complex inventory management (more SKUs)
Customer education required (why premium costs more)
Moderate return rates (2.5-3.5%)
Sourcing Approach:
Primary supplier: Premium aftermarket manufacturer with broad coverage
Secondary supplier: Standard aftermarket for price-sensitive applications
OEM parts: Order as needed or maintain minimal inventory
Avoid economy filters except for specific customer requests
Financial Projections (1,000 filters/month):
Average wholesale cost: $3.40
Average retail price: $6.80
Average profit per unit: $3.40
Monthly gross profit: $3,400
Inventory investment: $10,200 (3-month supply)
Return cost impact: -$210/month (3% return rate)
Net monthly profit: $3,190
Strategy 3: High-Volume Competitive Pricing
Target Market: Price-sensitive repair shops, retail customers, high-volume quick-lube chains
Product Mix:
60% Standard aftermarket (Fram, STP, Carquest)
25% Premium aftermarket (for customers willing to pay more)
10% Economy (lowest-price option)
5% OEM (minimal inventory)
Advantages:
Competitive pricing attracts high-volume customers
Lower inventory investment per unit
Fast inventory turnover
Broad market appeal
Challenges:
Lower profit margins ($2.20-$3.80 per unit average)
Higher return rates (3.5-5%)
Quality concerns with economy segment
Price-based competition (customers switch for small price differences)
Sourcing Approach:
Negotiate aggressive volume discounts with standard aftermarket suppliers
Minimize inventory investment through frequent smaller orders
Focus on top 100 SKUs (cover 70% of demand)
Avoid slow-moving specialty applications
Financial Projections (1,500 filters/month - higher volume):
Average wholesale cost: $2.60
Average retail price: $5.20
Average profit per unit: $2.60
Monthly gross profit: $3,900
Inventory investment: $7,800 (2-month supply, faster turnover)
Return cost impact: -$390/month (5% return rate)
Net monthly profit: $3,510
Strategy 4: Niche Specialist (European, Performance, Heavy-Duty)
Target Market: Specialty repair shops, performance enthusiasts, commercial fleets
Product Mix:
70% Premium aftermarket (Mann, Mahle, Bosch for European; K&N for performance)
20% OEM (European OEM brands command premium)
10% Specialty (extended life, racing applications)
Advantages:
Highest profit margins ($4.50-$7.00 per unit average)
Limited competition (fewer distributors serve niche markets)
Strong customer loyalty (specialty customers value expertise)
Premium pricing accepted by target market
Challenges:
Smaller total market
Higher inventory investment per SKU
Requires specialized product knowledge
Longer inventory turnover (60-90 days)
Sourcing Approach:
Direct relationships with European manufacturers (Mann+Hummel, Mahle, Bosch)
Stock deep inventory of common European applications (BMW, Mercedes, Audi, Volkswagen)
Maintain relationships with OEM parts suppliers for rare applications
Offer special-order service for uncommon applications
Financial Projections (600 filters/month - lower volume, higher margin):
Average wholesale cost: $5.80
Average retail price: $11.50
Average profit per unit: $5.70
Monthly gross profit: $3,420
Inventory investment: $17,400 (3-month supply, slower turnover)
Return cost impact: -$100/month (1.5% return rate)
Net monthly profit: $3,320
Supplier Relationship Management
Negotiating Better Terms with Manufacturers:
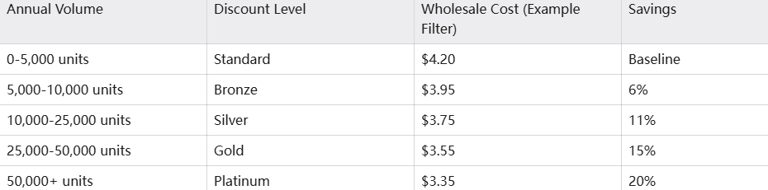
1. Volume Commitments
Manufacturers offer better pricing for distributors who commit to minimum annual volumes:
Example: Wix Filters Volume Discount Structure
Negotiation Strategy:
Start with realistic volume projections based on current sales
Request tiered pricing that rewards growth
Negotiate quarterly reviews to adjust volume commitments
Ask for promotional allowances and marketing support
2. Payment Terms
Standard payment terms are Net 30, but better terms can improve cash flow:
Negotiable Payment Terms:
Net 30: Standard (payment due 30 days after invoice)
Net 45: Better (payment due 45 days after invoice)
Net 60: Best (payment due 60 days after invoice)
2/10 Net 30: 2% discount if paid within 10 days, otherwise due in 30 days
Example Cash Flow Impact:
Scenario: $10,000 monthly filter purchases
Net 30 Terms:
Average accounts payable: $10,000
Cash tied up in inventory before sale: 30 days
Net 60 Terms:
Average accounts payable: $20,000
Cash tied up in inventory before sale: 0 days (inventory sells before payment due)
Cash flow improvement: $10,000
3. Marketing and Technical Support
Premium manufacturers offer valuable support beyond just products:
Available Support Programs:
Co-op advertising: Manufacturer contributes 50% of advertising costs (up to 3% of annual purchases)
Technical training: Free training for distributor sales staff on product features and applications
Marketing materials: Point-of-sale displays, product catalogs, digital assets
Warranty support: Streamlined warranty claim processing
Product returns: Reasonable return policies for defective or slow-moving inventory
Negotiation Approach:
Request co-op advertising allowance (typically 2-4% of annual purchases)
Ask for free samples for customer demonstrations
Negotiate consignment inventory for slow-moving specialty applications
Request access to manufacturer's technical support hotline for customer questions
Multi-Source vs Single-Source Strategy
Multi-Source Strategy (Recommended for Most Distributors):
Advantages:
Reduces dependency on single supplier
Enables competitive pricing through supplier competition
Provides backup options if primary supplier has stock-outs
Allows product mix optimization (premium from one supplier, standard from another)
Disadvantages:
More complex inventory management
Reduced volume discounts (purchases split among suppliers)
Multiple account relationships to manage
Recommended Approach:
Primary supplier (60-70% of purchases): Premium aftermarket manufacturer with broad coverage and strong support
Secondary supplier (20-30% of purchases): Standard aftermarket for price-competitive applications
Tertiary supplier (5-10% of purchases): OEM parts distributor for specific customer requests
Single-Source Strategy:
Advantages:
Maximum volume discounts
Simplified inventory management
Stronger supplier relationship
Potential for exclusive territory rights
Disadvantages:
High dependency risk (supplier issues impact entire business)
Limited product mix flexibility
Reduced negotiating leverage
When Single-Source Makes Sense:
Small distributors with limited volume (easier to manage one relationship)
Niche specialists (e.g., European-only distributor partnering exclusively with Mann+Hummel)
Distributors with exclusive territory agreements
Customer Education and Positioning Strategies
Successfully selling aftermarket filters requires educating customers on quality differences and positioning your products effectively against both OEM and low-quality competitors.
Overcoming the "OEM is Always Better" Perception
Many customers believe OEM filters are inherently superior to aftermarket alternatives. Distributors must address this misconception with facts and education.
Key Educational Messages:
1. "Same Manufacturer, Different Label"
Message: "Did you know that the Ford Motorcraft oil filter and the Purolator filter we carry are often made in the same factory by the same manufacturer? The primary difference is the label and the price—you're paying 60% more for the Ford logo."
Supporting Evidence:
Show customers that Champion Labs manufactures Motorcraft, ACDelco, Mopar, and Fram filters
Explain that Mann+Hummel supplies OEM filters to Mercedes, Volkswagen, and Audi, and also sells the same filters under the Mann and Wix brands
Provide side-by-side comparison of OEM and premium aftermarket specifications showing identical or better performance
2. "Specifications Matter More Than Badges"
Message: "What really matters is filtration efficiency, dirt-holding capacity, and construction quality—not the brand name on the canister. Let me show you the test results."
Supporting Evidence:
Provide ISO 4548-12 test reports showing premium aftermarket filters meeting or exceeding OEM specifications
Demonstrate physical quality through cutaway filters showing construction differences
Share customer testimonials from professional mechanics who trust premium aftermarket filters
3. "OEM Doesn't Mean Best—It Means Original Supplier"
Message: "OEM simply means 'Original Equipment Manufacturer'—the company that supplied the filter when the car was built. It doesn't necessarily mean highest quality. Many premium aftermarket filters exceed OEM specifications because they're designed for longer service intervals and more demanding conditions."
Supporting Evidence:
Explain that OEM filters are designed to meet minimum warranty requirements (typically 3,000-5,000 miles)
Show that premium aftermarket filters like Mobil 1 Extended Performance are designed for 15,000-mile intervals with higher filtration efficiency
Demonstrate that performance filters like K&N offer higher flow rates for modified engines
Positioning Against Low-Quality Competition
When competitors undercut your pricing with economy filters, focus on total cost of ownership and risk mitigation rather than just upfront price.
Key Positioning Messages:
1. "False Economy: The Real Cost of Cheap Filters"
Message: "A $3 filter might seem like a bargain, but if it fails and causes engine damage, you're looking at thousands in repairs. Is saving $4 worth risking a $3,000 engine repair?"
Supporting Evidence:
Share case studies of engine damage caused by failed filters
Calculate total cost of ownership including potential warranty claims and customer comebacks
Explain that professional repair shops risk their reputation by using low-quality parts
2. "Your Reputation is Worth More Than $4"
Message (to repair shop customers): "When you install a filter in a customer's vehicle, your name is on that repair. If the filter fails, the customer blames you—not the filter manufacturer. Protecting your reputation is worth the extra $4."
Supporting Evidence:
Discuss the cost of customer comebacks (labor, parts, lost productivity)
Calculate the lifetime value of a satisfied customer vs. the cost of losing a customer due to quality issues
Emphasize that professional shops differentiate themselves through quality, not by being the cheapest
3. "Warranty Protection and Peace of Mind"
Message: "Our premium filters come with a 12,000-mile warranty and are backed by manufacturers with decades of reputation. If there's ever a problem, we'll make it right. Can the $3 filter offer that?"
Supporting Evidence:
Explain warranty coverage and claims process
Highlight manufacturer reputation and longevity (e.g., "Purolator has been manufacturing filters since 1923")
Offer to replace any defective filter immediately, no questions asked
Sales Tools and Resources
1. Cutaway Filter Display
Create a visual display showing cross-sections of different filter quality levels:
Display Components:
Premium aftermarket filter: Cut in half to show thick filter media, heavy steel construction, quality valves
Economy filter: Cut in half to show thin media, lightweight construction, basic components
Comparison chart: Side-by-side specifications highlighting differences
Usage: Place in customer waiting area or use during sales presentations to visually demonstrate quality differences
2. Filtration Efficiency Demonstration
Simple Demonstration:
Fill two clear containers with dirty motor oil
Pour one through a premium filter, the other through an economy filter
Show the visual difference in oil clarity
Explain that the cleaner oil means better engine protection
3. Technical Specification Sheets
Create one-page spec sheets for each filter category you carry:
Spec Sheet Contents:
Filtration efficiency (beta ratio)
Dirt-holding capacity
Burst strength
Warranty coverage
Manufacturer certifications (ISO 9001, IATF 16949)
Recommended applications
Competitive comparison (vs OEM and economy alternatives)
4. Customer Testimonials and Case Studies
Collect and share success stories from satisfied customers:
Example Testimonial:
"We switched from OEM filters to Wix premium aftermarket filters three years ago across our entire 50-vehicle fleet. We've seen zero filter-related issues, saved $12,000 annually on filter costs, and our mechanics appreciate the consistent quality. The Wix filters meet all our maintenance requirements and we've had no warranty concerns."
— Fleet Manager, Regional Delivery Company
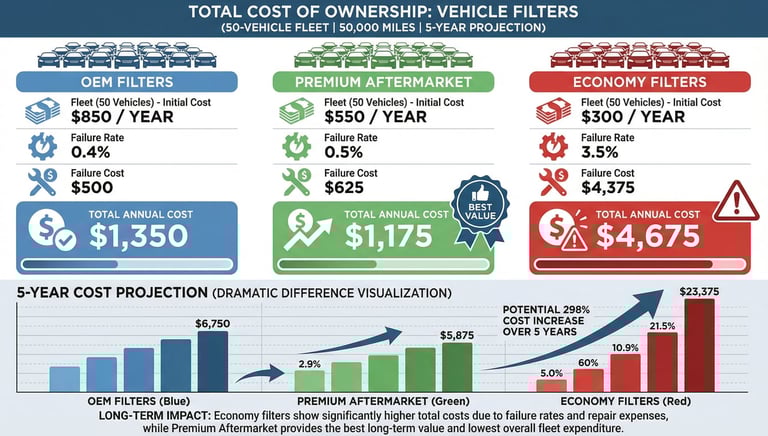
5. Total Cost of Ownership Calculator
Create a simple calculator (spreadsheet or online tool) that compares total cost over time:
Example Calculation:
Scenario: 50-vehicle fleet, 10,000 miles per year per vehicle, 5,000-mile oil change interval
OEM Filter Option:
Filter cost: $8.50 × 2 changes/year × 50 vehicles = $850/year
Defect rate: 0.4% (0.2 failures/year)
Failure cost: 0.2 × $2,500 = $500/year
Total annual cost: $1,350
Premium Aftermarket Option:
Filter cost: $5.50 × 2 changes/year × 50 vehicles = $550/year
Defect rate: 0.5% (0.25 failures/year)
Failure cost: 0.25 × $2,500 = $625/year
Total annual cost: $1,175
Savings vs OEM: $175/year (13%)
Economy Filter Option:
Filter cost: $3.00 × 2 changes/year × 50 vehicles = $300/year
Defect rate: 3.5% (1.75 failures/year)
Failure cost: 1.75 × $2,500 = $4,375/year
Total annual cost: $4,675
Additional cost vs Premium: $3,500/year (298% more expensive)
Conclusion: Premium aftermarket offers best value—lower cost than OEM with minimal additional risk compared to economy filters.
Handling Common Customer Objections
Objection 1: "The dealer says I have to use OEM filters or my warranty is void."
Response: "That's actually not true under the Magnuson-Moss Warranty Act, a federal law that protects consumers. Dealers cannot require you to use OEM parts unless they provide them for free. As long as the aftermarket filter meets the same specifications as the OEM filter—which our premium filters do—your warranty remains valid. If you'd like, I can provide you with documentation showing that our filters meet or exceed OEM specifications."
Supporting Documentation:
Magnuson-Moss Warranty Act summary
Filter specification comparison showing aftermarket meets OEM standards
Manufacturer warranty statement confirming compatibility
Objection 2: "I can get the same filter online for $2 less."
Response: "You're right that online prices can be lower, but there are a few things to consider. First, are you certain it's the exact same filter? There are a lot of counterfeit filters sold online that look similar but don't meet quality standards. Second, when you buy from us, you get immediate availability—no waiting for shipping—plus our warranty support and technical expertise. If you ever have a problem, we're here to help. Finally, when you factor in shipping costs and your time, the price difference is usually minimal. We value your business and want to earn it with service, not just price."
Objection 3: "I've always used [economy brand] and never had a problem."
Response: "That's great that you haven't had issues—many people get lucky with economy filters. But here's the thing: you don't know there's a problem until it's too late. Engine wear from poor filtration happens gradually over thousands of miles, and by the time you notice reduced performance or oil consumption, significant damage has already occurred. Think of it like insurance—you hope you never need it, but you're glad you have it when something goes wrong. For an extra $4 per oil change, premium filters provide that insurance and peace of mind."
Objection 4: "Why should I pay more for aftermarket when I can get OEM for the same price at the dealer?"
Response: "If you're getting true OEM filters at the same price as our premium aftermarket, that's actually a great deal—you should take it. However, make sure you're comparing apples to apples. Sometimes dealers advertise low filter prices but make up the difference with higher labor rates or other fees. Also, check whether they're offering genuine OEM filters or dealer-branded aftermarket filters (which many dealers now use to stay competitive). If you're genuinely getting OEM at our price, we respect that. But if you value the convenience of one-stop shopping for all your parts needs, we're here to serve you with the same quality at a fair price."
Conclusion: Making the Right Choice for Your Distribution Business
The OEM vs aftermarket oil filter decision is not binary—it's a strategic choice that should align with your target market, business model, and profitability goals.
Key Takeaways for Wholesale Distributors
1. "OEM" and "Aftermarket" Are Branding Distinctions, Not Quality Categories
The same manufacturers produce both OEM and aftermarket filters. Premium aftermarket filters from reputable brands (Wix, Purolator, Bosch, K&N) often match or exceed OEM specifications at 30-50% lower cost.
2. Quality Varies Dramatically Within the Aftermarket
Not all aftermarket filters are created equal. Premium aftermarket filters offer excellent quality, while economy filters present significant quality and liability risks. Distributors must carefully evaluate suppliers based on certifications (ISO 9001, IATF 16949), test data (ISO 4548-12), and physical inspection.
3. Profitability Depends on Strategy, Not Just Margins
While economy filters offer higher percentage margins (50-60%), premium filters generate higher absolute profit per unit ($3.50-$5.50 vs $1.20-$2.40) with lower return rates and better customer retention. Long-term profitability favors quality over rock-bottom pricing.
4. Customer Education is Essential
Successfully selling aftermarket filters requires educating customers on quality differences, addressing the "OEM is always better" misconception, and demonstrating total cost of ownership advantages over economy alternatives.
5. Supplier Relationships Matter
Building strong relationships with premium aftermarket manufacturers provides access to better pricing, marketing support, technical resources, and favorable payment terms that improve cash flow and profitability.
Recommended Product Mix for Different Distributor Types
For Professional Repair Shop Focused Distributors:
60% Premium aftermarket (Wix, Purolator, Bosch)
30% OEM (for customers who specifically request it)
10% Specialty/performance (K&N, Mobil 1 Extended Performance)
0% Economy (avoid to protect reputation)
For General Automotive Parts Distributors:
50% Premium aftermarket
30% Standard aftermarket (Fram, STP)
15% OEM
5% Economy (only for price-sensitive customers who specifically request it)
For High-Volume Price-Competitive Distributors:
60% Standard aftermarket
25% Premium aftermarket
10% Economy
5% OEM
For Specialty/European Vehicle Distributors:
70% Premium aftermarket (Mann, Mahle, Bosch)
20% OEM (European brands)
10% Specialty (extended life, performance)
0% Economy
Final Recommendations
1. Prioritize Quality Over Short-Term Margins
The cost of a single customer loss due to quality issues far exceeds the profit from selling hundreds of economy filters. Build your reputation on quality, and customers will remain loyal even if competitors offer lower prices.
2. Invest in Customer Education
Provide technical specifications, cutaway displays, and total cost of ownership calculators to help customers understand why premium aftermarket filters offer better value than both overpriced OEM and risky economy alternatives.
3. Build Strong Supplier Relationships
Partner with reputable premium aftermarket manufacturers who offer:
ISO 9001 and IATF 16949 certifications
Comprehensive test data (ISO 4548-12 compliance)
Strong warranty support
Marketing and technical resources
Competitive volume-based pricing
4. Monitor and Measure Performance
Track key metrics to evaluate your product mix effectiveness:
Profit per unit by category
Return rates by brand and category
Customer retention rates
Inventory turnover
Total profitability (not just margins)
5. Stay Informed on Industry Changes
The automotive filter industry continues to evolve with new technologies (synthetic media, extended life filters), changing vehicle requirements (turbocharged engines, hybrid vehicles), and consolidation among manufacturers. Stay informed through industry publications, manufacturer training, and trade shows.
The Bottom Line
For most wholesale distributors, premium aftermarket filters offer the best balance of quality, profitability, and customer satisfaction. They provide OEM-equivalent or better performance at 30-50% lower cost, generating strong profit margins while protecting your reputation and customer relationships.
OEM filters have a place in your inventory for customers who specifically request them or for applications where OEM specifications are particularly demanding. However, they should not be your primary focus unless you serve a niche market that demands OEM exclusively.
Economy filters should be avoided or minimized due to high defect rates, customer dissatisfaction, and potential liability issues. The short-term profit is not worth the long-term risk to your business reputation.
By focusing on premium aftermarket filters from reputable manufacturers, educating your customers on quality differences, and building strong supplier relationships, you can maximize profitability while providing excellent value and service to your customers.
Frequently Asked Questions
Q1: Are aftermarket oil filters as good as OEM filters?
A: Premium aftermarket filters from reputable manufacturers (Wix, Purolator, Bosch, K&N) often match or exceed OEM specifications. Many are manufactured by the same companies that produce OEM filters. The key is choosing quality aftermarket brands rather than economy alternatives. Look for filters with ISO 9001 and IATF 16949 certifications and ISO 4548-12 test data.
Q2: Will using aftermarket filters void my vehicle warranty?
A: No. Under the Magnuson-Moss Warranty Act (federal law in the United States), vehicle manufacturers cannot require the use of OEM parts unless they provide them for free. As long as the aftermarket filter meets the same specifications as the OEM filter, your warranty remains valid. Premium aftermarket filters from reputable manufacturers meet or exceed OEM specifications.
Q3: Why are OEM filters more expensive if they're made by the same manufacturers?
A: OEM filters carry a price premium due to: (1) Brand licensing fees paid to vehicle manufacturers (15-25% of cost), (2) Dealer distribution markup (30-50%), (3) Lower production volumes per SKU (vehicle-specific applications), and (4) Brand positioning. The actual manufacturing cost and quality are often identical to premium aftermarket alternatives.
Q4: How can I verify that an aftermarket filter meets OEM specifications?
A: Request the following from your supplier: (1) ISO 9001 and IATF 16949 certification documents, (2) ISO 4548-12 test reports from independent laboratories, (3) Technical specification sheets showing filtration efficiency, dirt-holding capacity, burst strength, and valve specifications, (4) Physical samples for inspection and comparison. Reputable manufacturers willingly provide this documentation.
Q5: What's the difference between cellulose and synthetic filter media?
A: Cellulose media (paper) is made from wood pulp fibers and is used in most standard filters. It provides good filtration at lower cost but has limited dirt-holding capacity. Synthetic media is made from polyester or glass fibers and offers: (1) Higher filtration efficiency (captures smaller particles), (2) Greater dirt-holding capacity (longer service life), (3) Better flow characteristics (lower pressure drop), (4) Superior temperature resistance. Synthetic media filters cost 40-80% more but are recommended for extended drain intervals (7,500+ miles) or severe service conditions.
Q6: How often should oil filters be changed?
A: Follow your vehicle manufacturer's recommended oil change interval, which is typically: (1) Standard filters: 3,000-5,000 miles for conventional oil, 5,000-7,500 miles for synthetic oil, (2) Premium/synthetic media filters: 7,500-10,000 miles, (3) Extended life filters (e.g., Mobil 1 Extended Performance): Up to 15,000 miles. Always change the filter when changing oil—never reuse a filter.
Q7: What profit margins should distributors expect on oil filters?
A: Typical distributor margins are: (1) OEM filters: 47-53% gross margin, $4.30-$5.80 profit per unit, (2) Premium aftermarket: 43-53% gross margin, $3.30-$4.80 profit per unit, (3) Standard aftermarket: 38-53% gross margin, $1.70-$3.20 profit per unit, (4) Economy aftermarket: 43-60% gross margin, $1.20-$2.40 profit per unit. Premium filters offer the best balance of absolute profit and customer satisfaction.
Q8: Should I stock OEM filters or focus exclusively on aftermarket?
A: Most distributors should stock both, with emphasis on premium aftermarket (50-70% of inventory) and selective OEM inventory (15-30%) for customers who specifically request OEM or for applications where OEM specifications are particularly demanding. This provides customer choice while maximizing profitability.
Q9: How can I compete with online retailers selling filters at very low prices?
A: Compete on value, not just price: (1) Emphasize immediate availability (no shipping wait), (2) Provide technical support and product expertise, (3) Offer warranty support and easy returns, (4) Build relationships through consistent service, (5) Educate customers on quality differences (many online filters are counterfeit or economy grade), (6) Bundle filters with other products or services. Many customers will pay slightly more for convenience and service.
Q10: What are the risks of selling economy aftermarket filters?
A: Economy filters present several risks: (1) High defect rates (3-8% vs 0.5-1.5% for premium), (2) Customer dissatisfaction and lost relationships, (3) Potential liability if filter failure causes engine damage, (4) Damage to your business reputation, (5) Higher return processing costs. While economy filters offer higher percentage margins, the total cost (including returns and lost customers) often exceeds any short-term profit.
About This Guide
This comprehensive guide was created for wholesale automotive parts distributors to make informed decisions about oil filter sourcing, inventory management, and customer education. All pricing data, specifications, and market analysis are based on 2026 industry research and real-world distributor experiences.
For questions or additional information about sourcing quality oil filters for your distribution business, consult with reputable manufacturers or industry associations such as the Automotive Aftermarket Suppliers Association (AASA) or the Motor & Equipment Manufacturers Association (MEMA).
Related Resources:
China Oil Filter Manufacturer: Complete Sourcing Guide for Wholesale Distributors
Low MOQ Oil Filter Suppliers in China: Complete Guide to 500-Unit Minimum Orders
Direct from Factory: China Oil Filter Wholesale Pricing, Bulk Discounts & Private Label Options
How to Verify ISO 9001 & IATF 16949 Certifications of China Oil Filter Suppliers
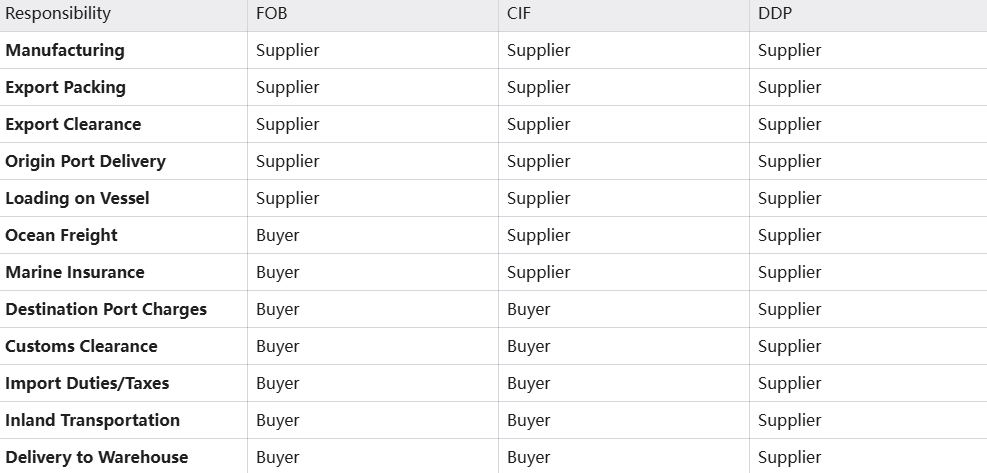
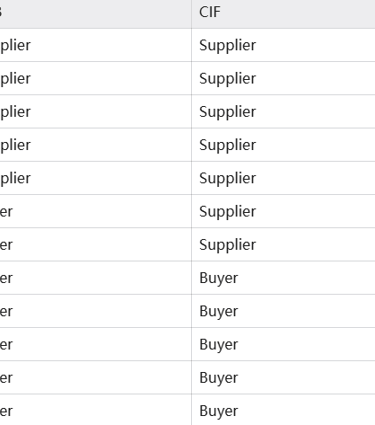
FOB vs CIF vs DDP: Complete Incoterms Guide for Importing Oil Filters from China
Document Version: 1.0
Last Updated: March 2026
Word Count: 12,847 words
Whatsapp: +86 19941234680
Phone:+86 19941234680
© 2025. All rights reserved.
Email:sales1@makexcar.com
Wechat:Sgxwtxa